This tutorial shows you how to easily make interactive 3D Spectrogams like this using Audacity. The source files are zipped up here which includes the “spectrogram.html” file you will need for your own spectrogram.
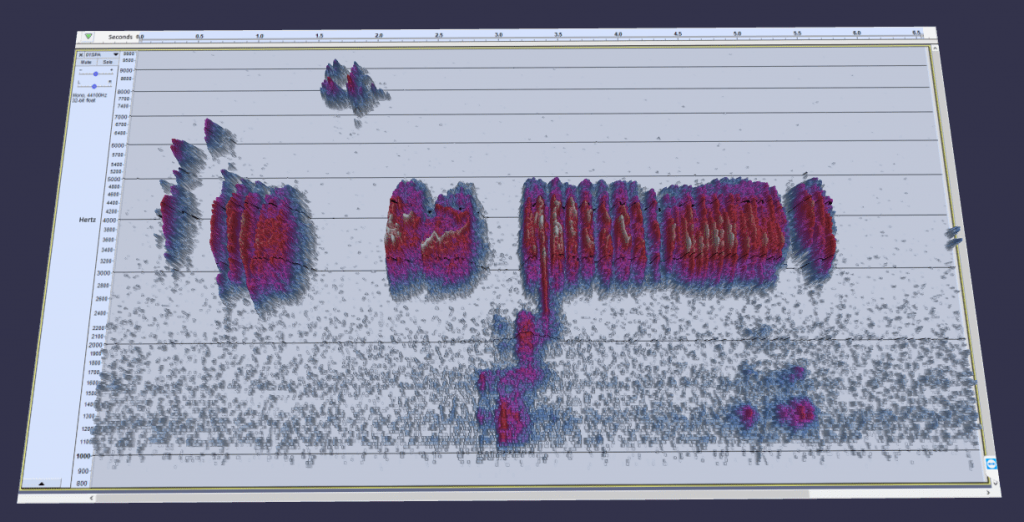
Click image for interactive 3D version
The 3D graphics are powered by the Babylon.js framework which does all the hard stuff for you.
1. Select Your Audio:- Choose the audio you want to display, optimise it and save it to “original.wav”.
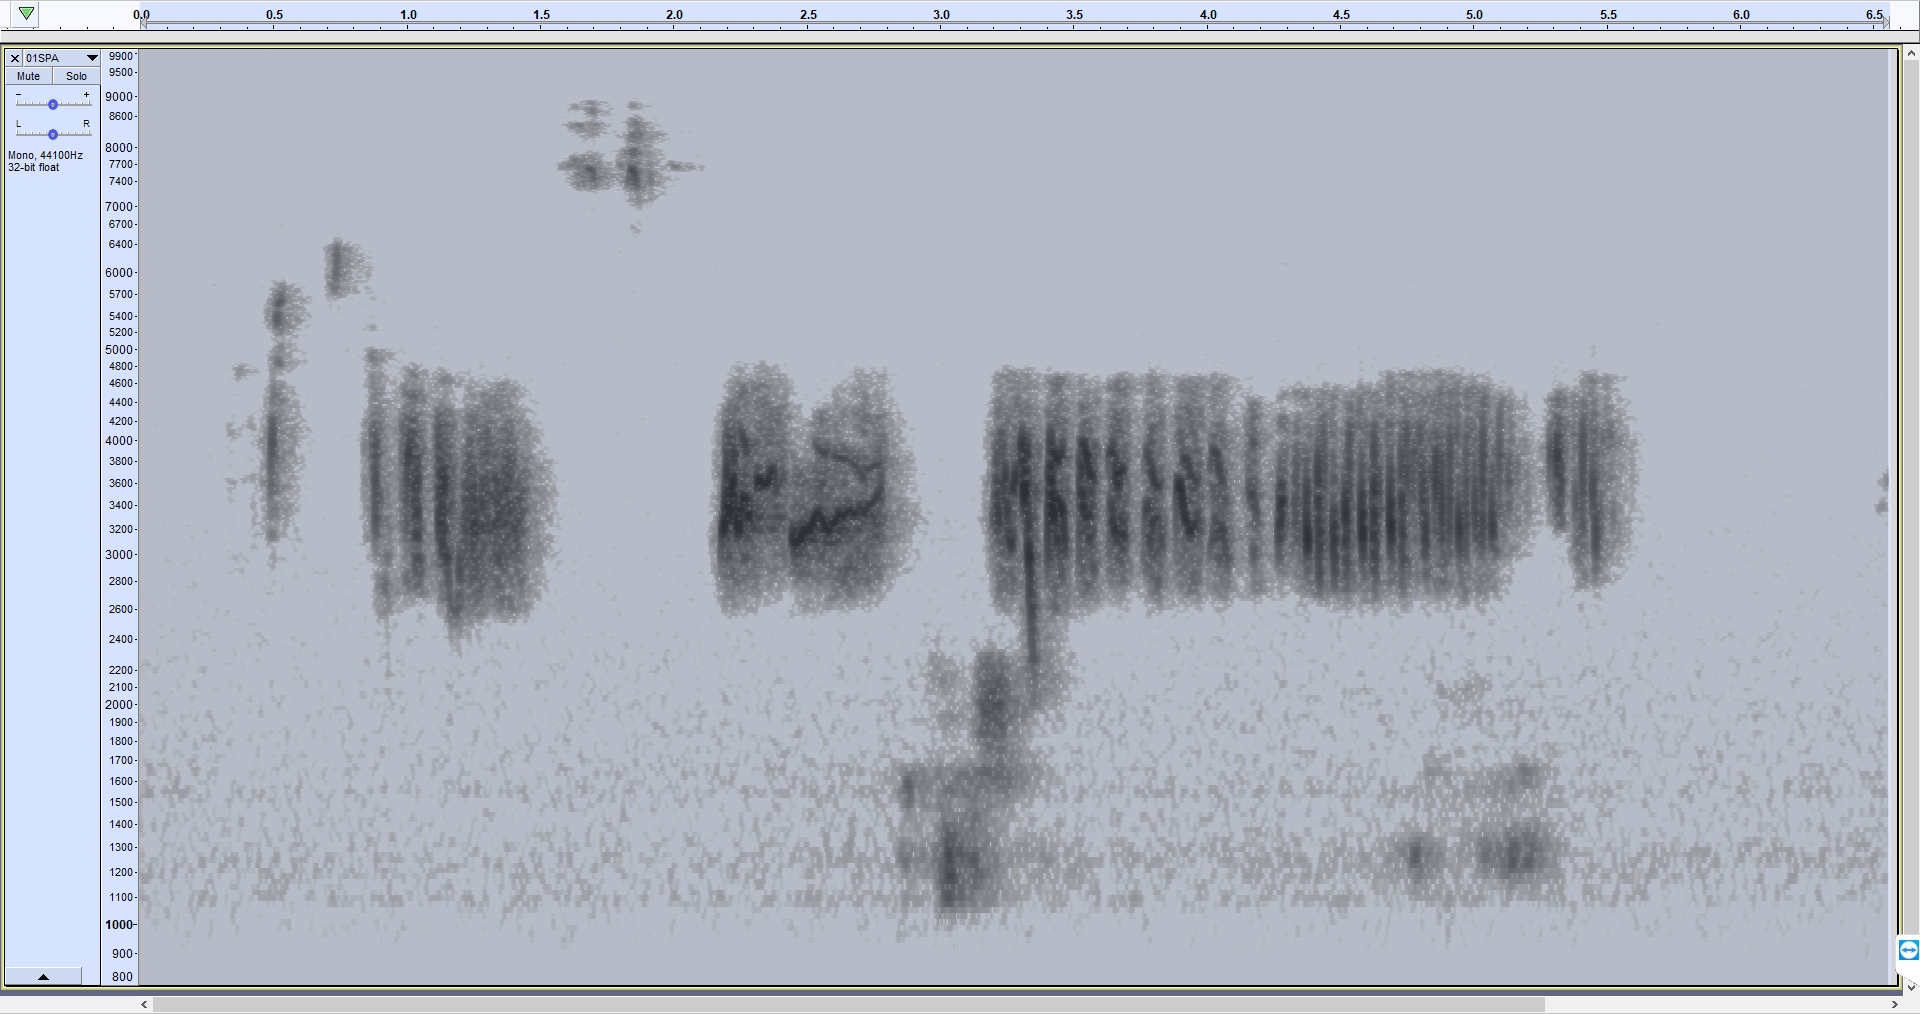
2. Grab Audacity Screenshots:- Load “original.wav” and show its color spectrogram. Hide all toolbars and zoom in to fill track with audio information. Use Audacity>Help>Tools>Screenshot Tools to take a color screenshot. Change spectrogram to monochrome and take another screenshot.

3. Edit Monochrome Screenshot:- Use Paint.Net or GIMP to remove borders around spectrogram panel(s) using background color of spectrogam. To do this, use the eyedropper color selector to pick a color on a quiet part of the spectrogram. Then draw borderless, filled rectangles to hide the audacity window borders like so and save as “mono.png”.
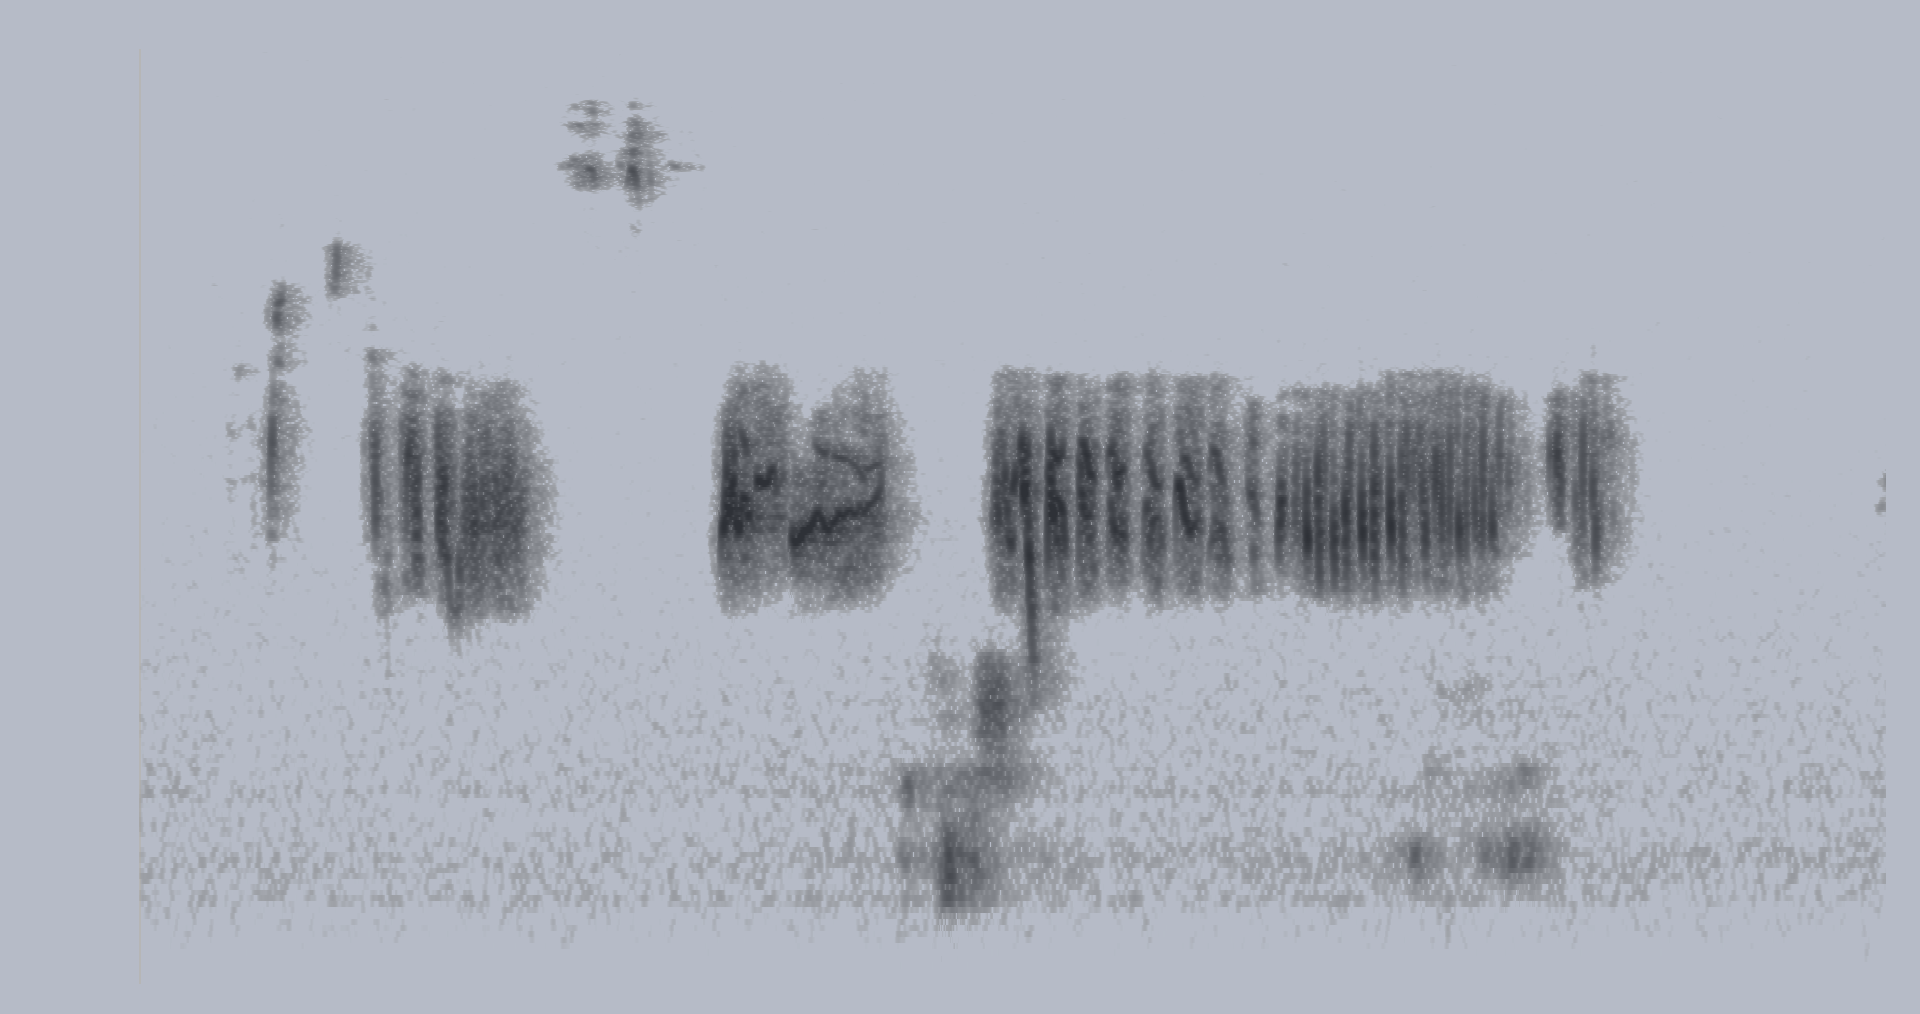
mono.png
4. Edit Color Screenshot (Optional):- Use Paint.Net or GIMP to add grid lines and text if required and save as “color.png” (otherwise rename color screenshot to “color.png”).
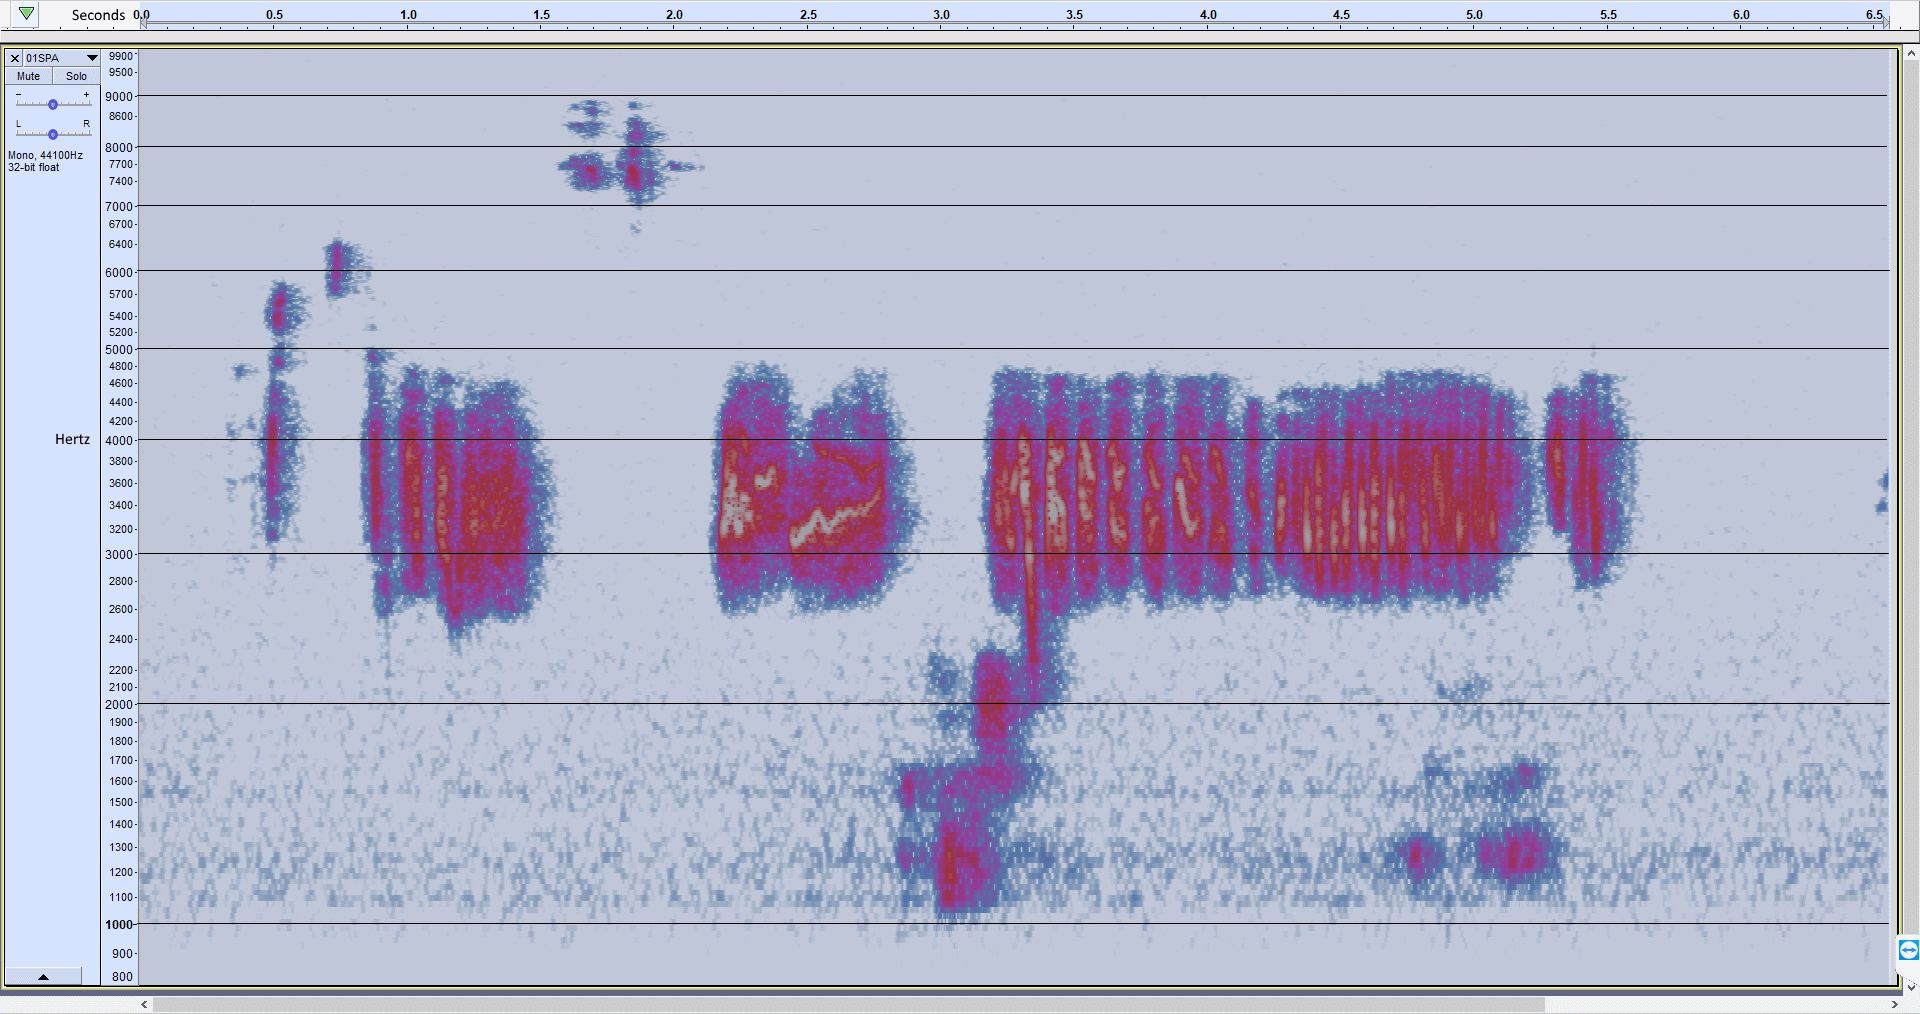
color.png
5. Save Audio to MP3:- I edited “original.wav” to add a 5 second silence followed by a half speed copy of the audio followed by another 5s silence. Whatever you do, export the audio to “audio.mp3”.
6. Show and Share Spectrogram:- Make a folder containing “color.png”, “mono.png”, “audio.mp3” and “spectrogram.html”. Clicking on “spectrogram.html” will display the 3D spectrogram in your browser. Zoom in with your mouse wheel and click-drag to rotate the view. You can also upload the folder to a web site and if you do, please link back to this tutorial so others can try it out.
7. Advanced Options:- The above steps will let you create a 3D spectrogram without any coding. It will be in 16×9 format which you can change by editing “spectrogram.html” in a text editor like NotePad. Edit the following line as needed
var ground = BABYLON.Mesh.CreateGroundFromHeightMap(“ground”, heightmap, 500, 264, 1000, 40, -40, scene, false);
where:-
500 = width of spectrogram
264 = height of spectrogram
1000 = level of detail, increase for more detail but slower model
40 and -40 = minimum and maximum elevations of data points
Make sure you save your file as “spectrogram.html” rather than with a “.txt” extension.
Sorry, the comment form is closed at this time.