Jan 122026
Video shows massive stars being fired into star clusters and how they interact under gravity alone.
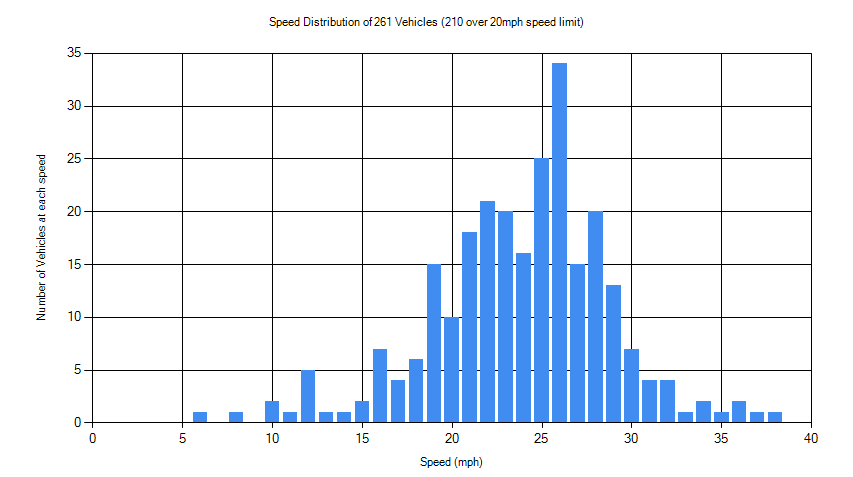
Here are the first results from my upcoming SpeedCam app which turns any camera capable of shooting video into a radar speed gun. The graph below is a summary of traffic speed in my street over a 7 hour period. SpeedCam also saves a picture of each vehicle with its speed printed.
This was taken with my Coronado PST solar scope from Inverness, Scotland over 8 hours of sunshine. It repeats a couple of times at different speeds so you can watch the action.
I made this simulation a few years ago in my StarryOrbits gravity laboratory app. It uses a simplified model of the galaxies with the core stars in red or blue and the halo stars in yellow or green. Newton’s laws of motion are then used to predict what will happen in the future. The simulation repeats a few times so you can watch it properly. What is interesting is that the 2 galaxy cores stay mostly intact even after they have passed thru each other a few times. It is actually better to watch it in StarryOrbits because it has a 3D viewer that lets you rotate, pan and zoom while the animation is playing. Great to have a couple of galaxies on your PC to play with.
Unfortunately, changes to Java security policy means I can no longer distribute the original StarryOrbits. However, I am looking at rewriting it to take advantage of modern multicore CPUs and GPUs.
I have just received a bunch of email bounce notices which seen to come from German speaking accounts.
I can assure you that I had nothing to do with these emails and you should treat them as fraudulent.
Ich habe gerade eine Reihe von E-Mail-Bounce-Hinweise, die aus dem deutschsprachigen Raum Konten zu kommen gesehen.
Ich kann Ihnen versichern, dass ich nichts mit dieser E-Mails zu tun hatte, und Sie sollten sie als betrügerisch zu behandeln.
SmarTrak is DSSR’s helper that steps in to guide your scope when the guide taget is lost due to cloud or other obstructions. I seem to have broken it in DSSR5 and I have added some logging features to help me fix it. These can also give you an insight into how DSSR is controlling your scope.
When DSSR loses the guide target it logs the guiding history like so:
08:22:17.838 Target lost – SmartTracking
08:22:17.839 SmartTrak totalTms:4638563 ppmsH:-0.01001258 intH:-49937.2 pH:-500.0 ppmsV:-0.03671094 intV:-13619.9 pV:-500.0
08:22:17.839 ,0001,6834,0,0
08:22:17.839 ,0002,7170,51,305
08:22:17.839 ,0003,7668,103,508
08:22:17.839 ,0004,8266,155,711
08:22:17.839 ,0005,8662,-310,-1322
08:22:17.839 ,0006,65300,-310,-1220….. etc for all stored guide history points.
Each red line contains the log time, point index, time in milliseconds since the last guide pulse and the pulse times in milliseconds for the RA and declination axes. You can copy and paste these points into a spreadsheet and chart the guide pulses in each axis against time. Below is the RA chart for one of my sessions.
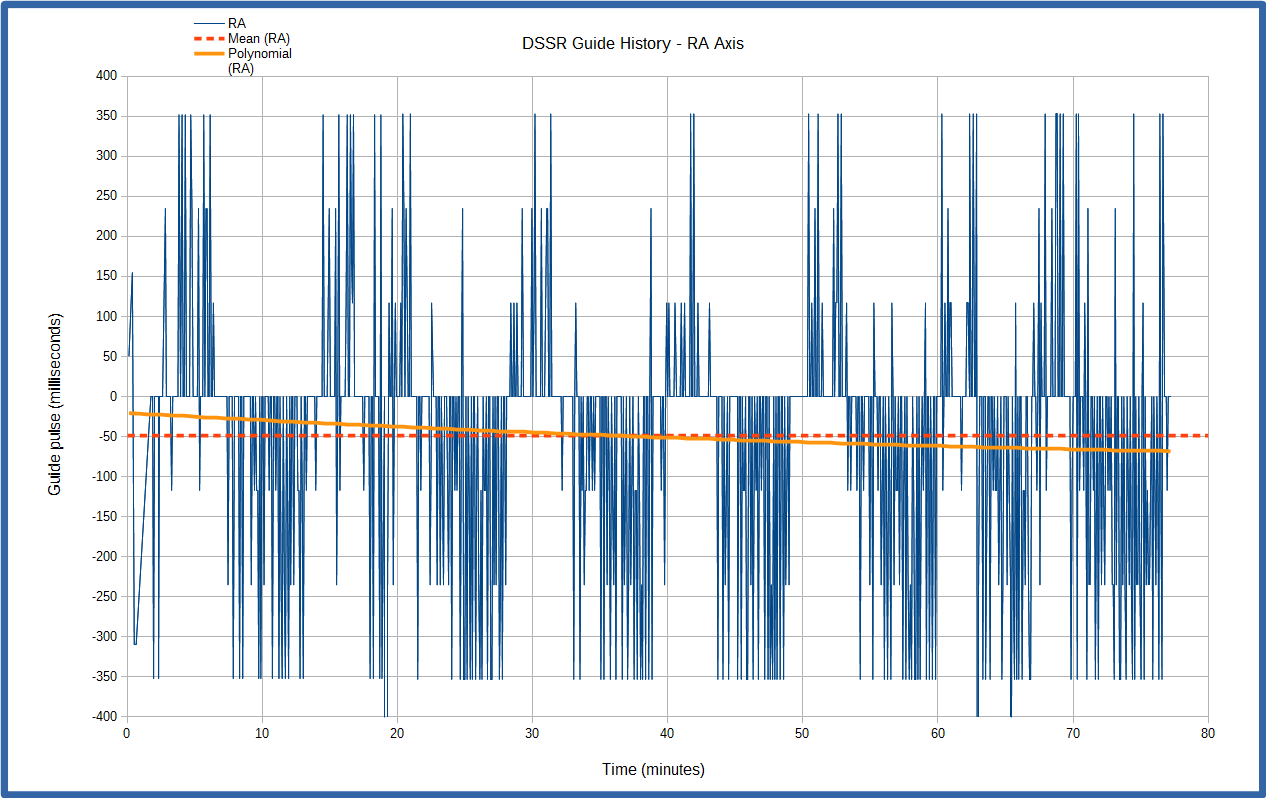
Click for full image
This shows the plus or minus RA guide pulses have a recurring period of about 10 minutes. I don’t use periodic error correction on my HEQ5 Pro but this chart shows that I probably should. When I play back my session videos I can clearly see the target moving back and forward in RA around a mean position during SmartTraking.
SmartTrak applies the mean pulse (-50ms red dotted line) but you can see that the polynomial trend line runs from -20ms at 78 minutes ago to -70ms when SmartTrak kicked in at right on the chart. This suggests that I need to cut my number of history points down to cover say just 2 cycles or 20 minutes. This will give a better mean pulse time for SmartTrak to use.
The fact that the mean line is not at 0ms suggests that my mount still has an alignment error. You can see a similar alignment error in the declination chart below.

Click for full image
This shows that all the guide pulses are negative and there seems to be a much shorter periodic error. The mean pulse is -175ms but the polynomial trend is at -150ms when SmarTrak kicks in at right. Again this suggests that fewer history points are needed to give a more accurate mean value.
The above charts have been very useful to help me see what DSSR is doing during autoguiding and I hope to have SmartTrak fully operational soon.
You can try this out for yourself by changing your screenshot interval to 5 seconds, turning on logging, checking the SmartTrak box and then guiding for an hour say. Then raise the minimum guide similarity to 999 to force SmartTrak to kick in and leave it running until the target leaves the field of view. Make a session video as per Appendix E of the manual and scrub it back and forward in VirtualDub to see how SmartTrak is faring.
You can then use a spreadsheet to construct the charts above. I used the free LibreOffice Calc spreadsheet for mine.